


Measure SEO by whether it helps bring suitable customers to your business at a cost that makes sense. Use search visibility and traffic to explain progress, then connect them to qualified inquiries, sales, and customer value wherever the evidence allows.
Build a five-stage scorecard
Relevant visibility. Track whether your important services and pages appear for appropriate searches. Separate searches for your business name from broader customer searches when practical. A rise in branded interest may also reflect referrals, advertising, or other activity.
Useful visits. Review organic visitors to commercially important pages, not just the whole-site total. Search Console provides clicks, impressions, click-through rate, and average position. Those measures describe search performance; they do not identify which visitors became customers.
Completed inquiries. Count real calls, submitted forms, bookings, or purchases, depending on your business. Test that your tracking records the intended action. Keep call-button clicks separate from confirmed calls if that is all the data can show.
Qualified opportunities. Mark which inquiries meet your criteria and remove spam or duplicates. Record why other inquiries were unsuitable. This helps you distinguish more demand from better demand.
Customers and commercial value. Track which opportunities become customers, the value of those sales, and the costs of serving them. For longer sales cycles, report open opportunities separately from completed sales.
Example: follow inquiries through to customers
Illustrative example only. These numbers are not SmallBizSEO client results, package prices, industry benchmarks, or a forecast.
Suppose a service business assigns $1,200 in SEO-related costs to a defined evaluation period. It follows the same group of 20 genuine, unique inquiries associated with organic search through its sales process. Ten meet its qualification criteria, and two become paying customers by the review date. The example assumes duplicate inquiries have been removed and every customer is included in the qualified group.
The funnel is:
20 genuine inquiries: unique prospective opportunities after removing spam and duplicate contacts.
10 qualified opportunities: inquiries matching the business's actual service, location, project, or other fit requirements.
2 new paying customers: qualified opportunities that became customers by the review date.
From that one group:
Qualification rate: 10 divided by 20 = 50%.
Qualified-opportunity-to-customer rate: 2 divided by 10 = 20%.
Inquiry-to-customer rate: 2 divided by 20 = 10%.
Cost per genuine inquiry: $1,200 divided by 20 = $60.
Cost per qualified opportunity: $1,200 divided by 10 = $120.
Cost per acquired customer: $1,200 divided by 2 = $600.
The denominator matters. A 20% close rate here describes qualified opportunities, not all website visits or inquiries. If some opportunities are still open, label the result as provisional and update the same group later. Do not mix inquiries from one period with unrelated customers who first contacted you in another.
Use the funnel to choose what to investigate. Low qualification may point to an audience or offer mismatch. Qualified leads that rarely become customers call for a review of pricing fit, follow-up, capacity, and the buying process. Neither pattern proves the cause on its own.
A $600 acquisition cost is not automatically good or bad. Compare it with contribution profit, the full cost of acquisition, and how confidently the customers can be attributed to SEO. This funnel describes recorded outcomes; it does not prove that all two customers were additional customers created by SEO.
Source: SmallBizSEO worked example, prepared October 14, 2026. All figures are hypothetical; arithmetic is calculated from the stated assumptions. Google Analytics explains event measurement; this source does not supply the example’s figures or validate attribution.
Make comparisons that mean something
Use consistent definitions and compare similar periods. Note seasonal demand, website changes, pricing changes, service availability, and other marketing. A busy month compared with a quiet month can tell a misleading story.
Review trends over a period that fits your inquiry volume and sales cycle. With only a few leads, one unusually large job can dominate the numbers. Keep the underlying counts visible alongside percentages and avoid drawing a broad conclusion from a tiny sample.
Example: more clicks, lower CTR
Clicks can increase while click-through rate falls. The following hypothetical comparison keeps the underlying counts visible.
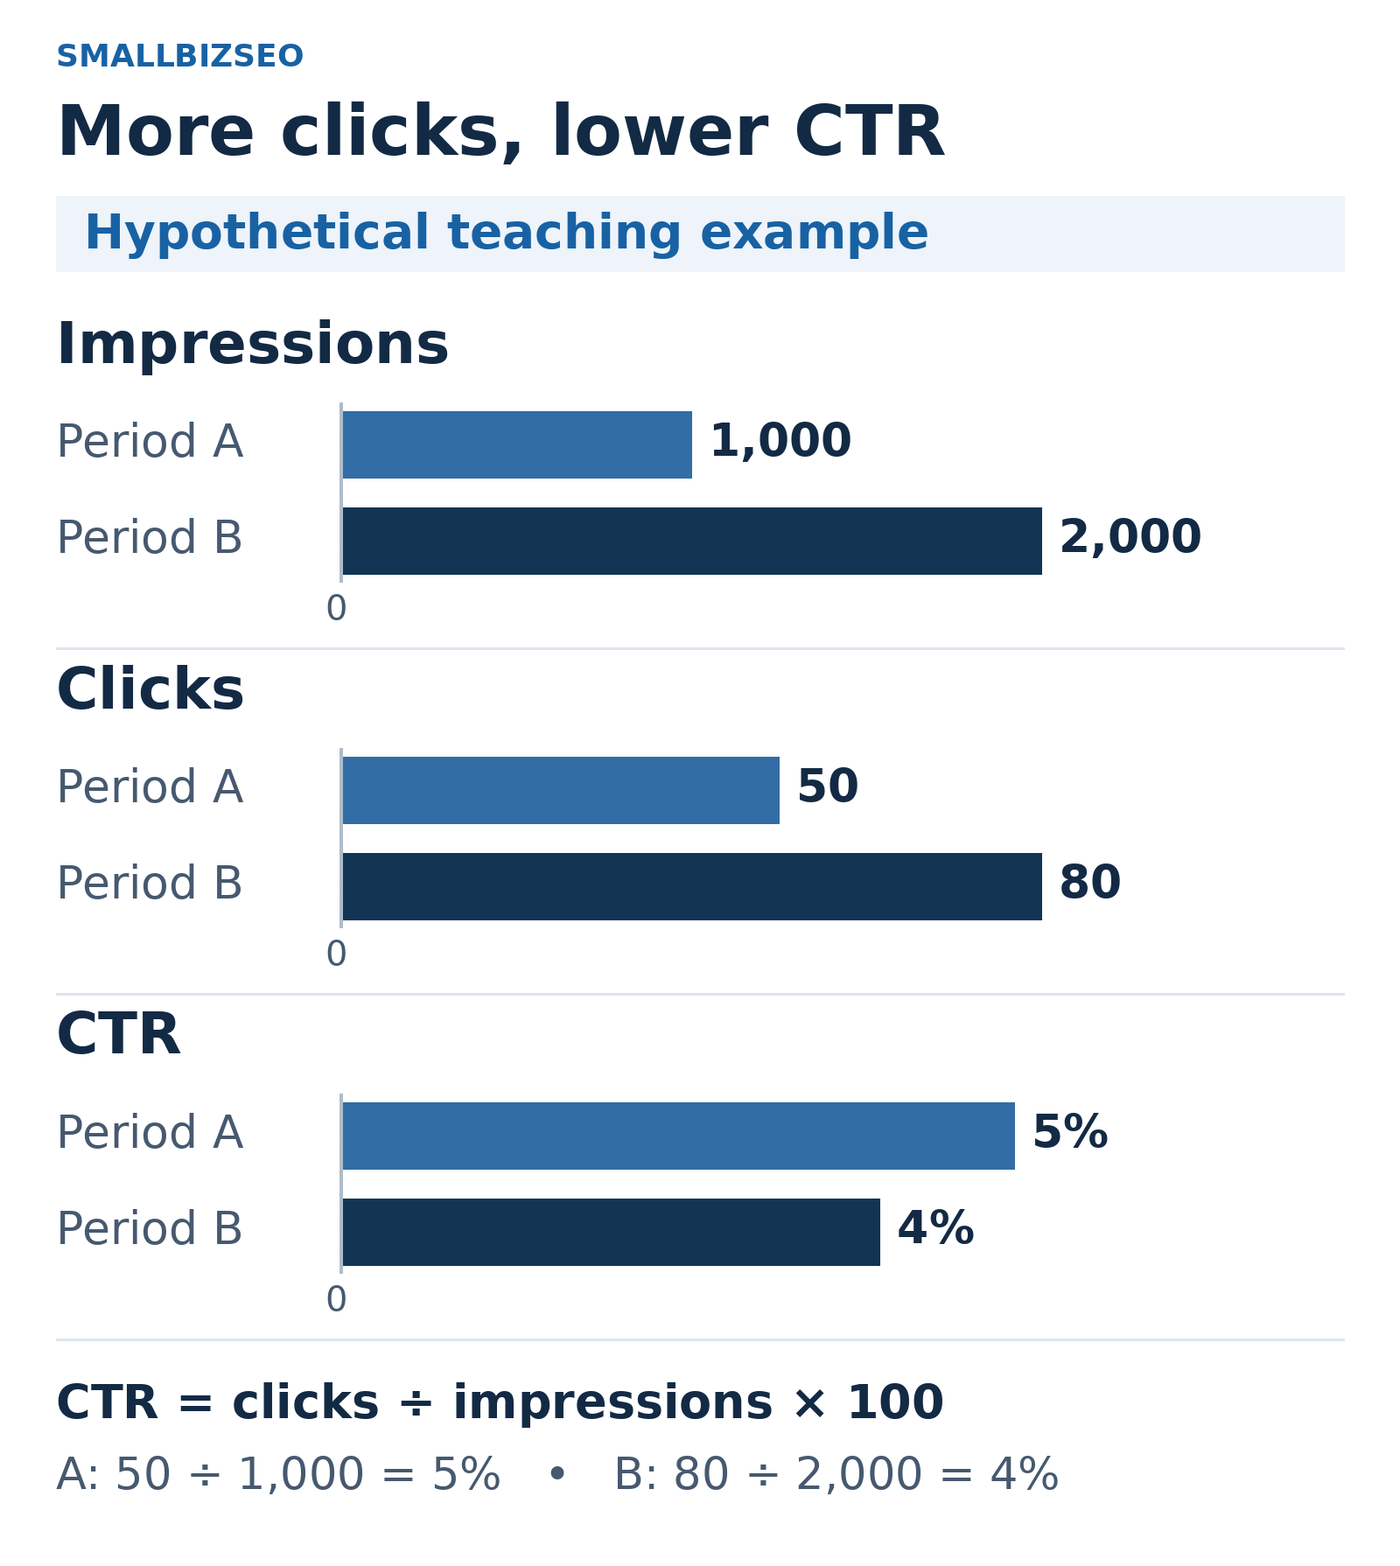
Hypothetical teaching example: clicks can increase while CTR falls. Period A has 50 clicks from 1,000 impressions (5% CTR); Period B has 80 clicks from 2,000 impressions (4% CTR). These are invented teaching values, not client results, benchmarks or forecasts.
Period | Impressions | Clicks | CTR |
|---|---|---|---|
A | 1,000 | 50 | 5% |
B | 2,000 | 80 | 4% |
Period A: 50 ÷ 1,000 = 5%. Period B: 80 ÷ 2,000 = 4%. CTR is clicks divided by impressions, expressed as a percentage. In this example impressions grow faster than clicks, so the percentage falls even though the click count rises. The example alone does not establish the cause of a change in real performance.
Each pair of bars has its own scale and zero baseline. Compare Period A with Period B within each metric; do not compare lengths between different metrics.
Source for the metric definition only: Google Search Console Performance report. Definition checked October 14, 2026. Google is not the source of the hypothetical values.
Use average position as supporting context. It aggregates results rather than giving every customer one fixed ranking. A change in the mix of searches can make a headline metric look better or worse without matching the business outcome.
Keep measurement honest and manageable
A website analytics tool, Search Console, and a simple inquiry log can provide a useful starting point. The systems may count different things, and tracking gaps can occur. Record what is known, what is estimated, and what cannot be confidently attributed.
Avoid reports that celebrate page counts, impressions, or rankings without explaining their connection to suitable demand. Also avoid assigning every sale to SEO simply because the customer visited the website.
Your next step
Choose one primary outcome, such as qualified quote requests, and a few supporting measures. Establish the baseline, test the tracking, and agree on a regular review where the numbers lead to a specific decision.