


SEO tools can disagree because they measure different things, use different datasets, or observe search results under different conditions. Some report first-party activity; others estimate traffic or track a selected keyword list. Before comparing numbers, check whether they represent the same question.
Start with the metric definition
“Traffic” might mean recorded sessions, clicks from Google, or a third-party estimate. “Rankings” might mean one observation for a chosen location or an average across many searches. Those figures are not interchangeable.
A vendor's estimate of a competitor's traffic should not be treated as a direct reading of that competitor's private analytics. Google states that external SEO tools do not have access to its internal ranking data and cannot guarantee performance.
Why can ranking observations differ?
Search results can vary with time, location, device, and search context. Search Console documentation explains that a result in your report may differ from what you see when repeating the query yourself. Its average position is an aggregated measure, rather than a promise that every searcher saw the same placement.
For a location-dependent service, observations from opposite sides of a city can be particularly different. Record the target area and device before comparing a tracker with a manual check.
How do I make a fair comparison?
Match the date range and reporting time zone.
Check whether the report covers a domain, subdomain, folder, or page.
Confirm the country, location, device, and search type.
Compare the same keyword set where rankings are involved.
Separate observed data from modeled estimates.
Note recent changes to tracking, filters, or the tool's methodology.
For example, a tool tracking twenty priority phrases may show declining average rankings while the site gains relevant visits from other topics. Neither report necessarily contradicts the other; they describe different parts of the picture.
Which source should drive decisions?
Use Search Console for Google search performance, website analytics for measured visits and actions, and customer records for lead quality and sales. Third-party tools can add competitive research and diagnostic context. Use each for the question it can actually answer.
Attach a definition card to every comparison
Before comparing two screenshots, write a six-field definition card for each number: metric, source, covered pages, time window, audience or search context, and collection method. If those fields differ, first explain the difference rather than choosing the more flattering number.
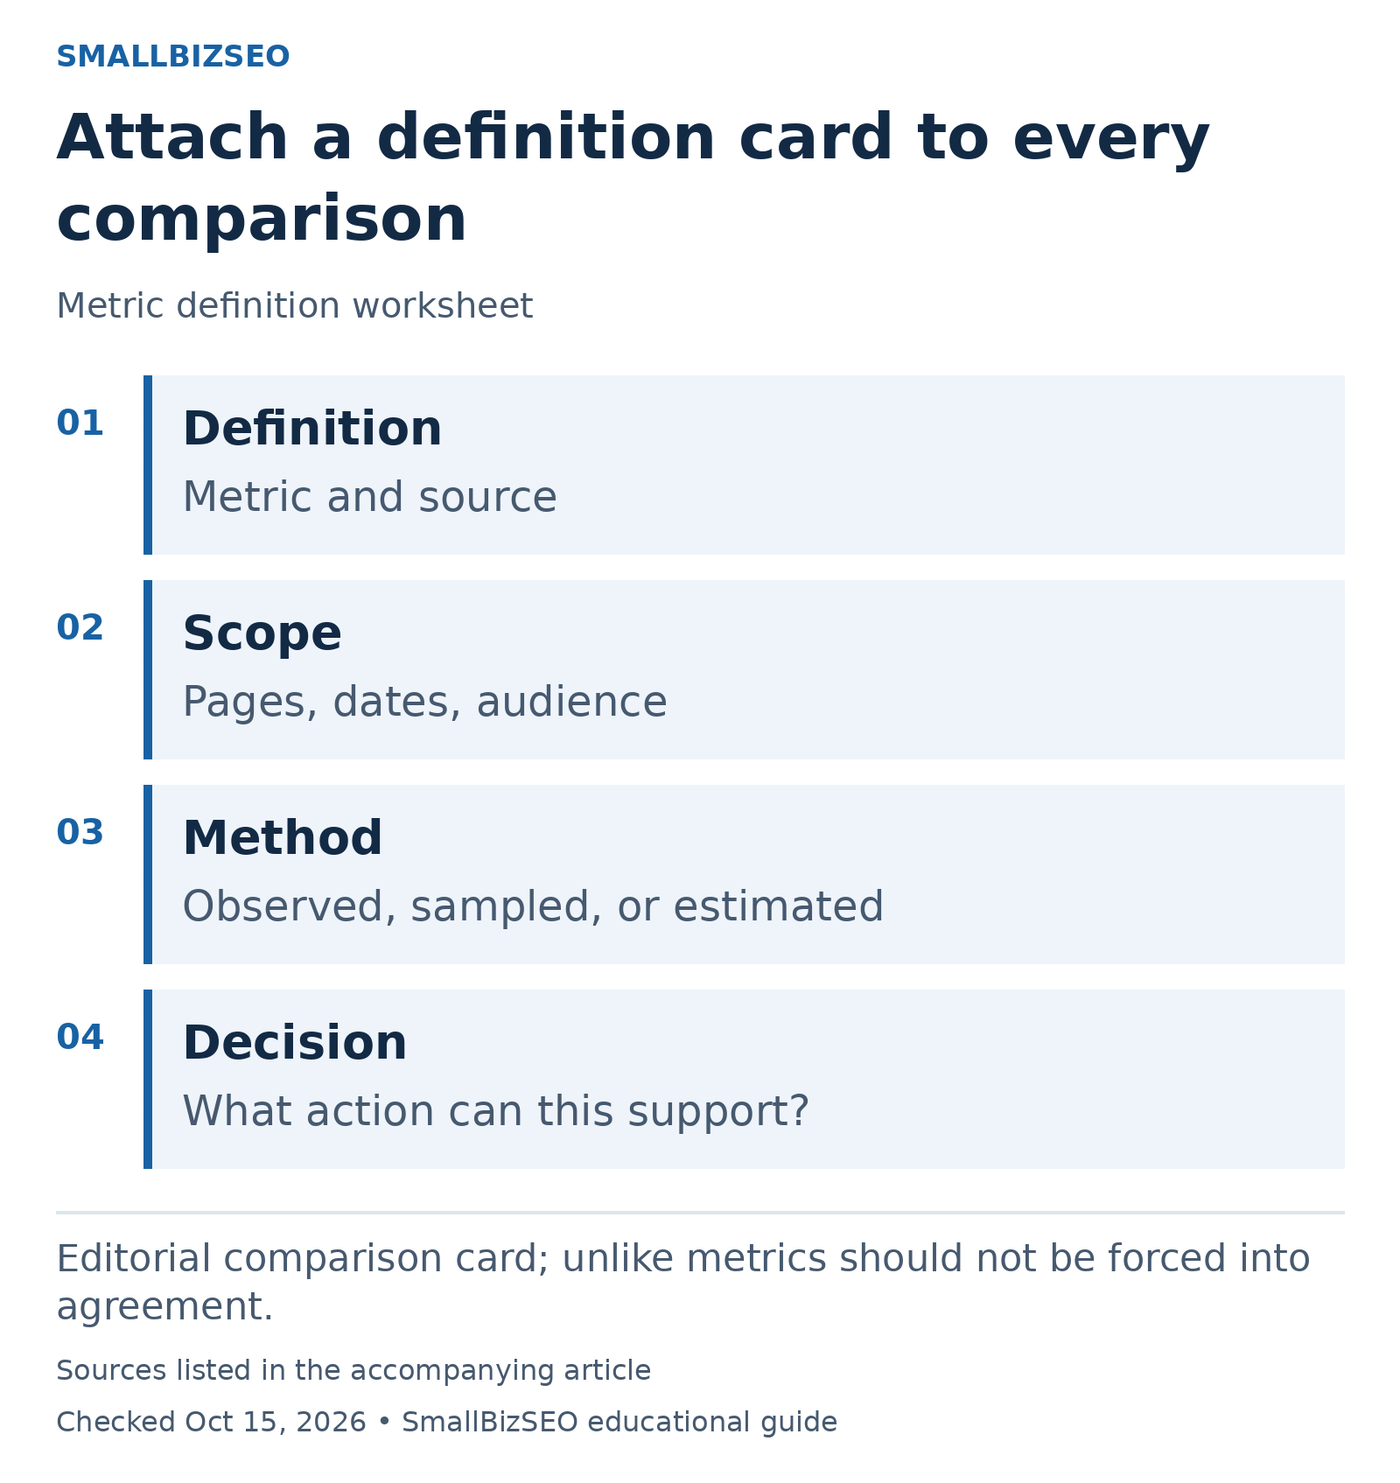
Editorial comparison card; unlike metrics should not be forced into agreement.
Sources: Google on third-party tools. Checked October 15, 2026. This visual is an editorial guide, not measured client results.
Hypothetical comparison: A rank tracker reports one city and a fixed shortlist of phrases. Search Console reports the website’s observed Google search performance across the selected reporting scope. The tracker can answer whether its chosen phrases changed in that setting; it cannot describe every search that exposed the website.
Choose one small overlap to investigate. Match an important page, relevant query, country, device, and period as closely as the tools allow. Record anything that still cannot be aligned, including local sampling or reporting aggregation. A remaining mismatch is useful context, not permission to invent a correction factor.
Give each metric a decision role. An external estimate may identify a competitor worth researching. Search data can reveal a page worth investigating. Recorded inquiries can establish whether the business is receiving useful demand. Keep those roles visible in the report.
Google’s third-party-tool guidance is a useful boundary: vendor metrics do not reveal Google’s private ranking calculations. Ask for a reproducible explanation before paying for work whose only justification is an unexplained score change.
Reference: Google on third-party tools
When should I investigate?
Investigate a material change that affects business decisions, particularly if several independent indicators move together. Ask the provider to explain the discrepancy in plain language and identify any implementation issue. Small differences between unlike systems do not need to be forced into agreement; unexplained changes in meaningful trends deserve attention.